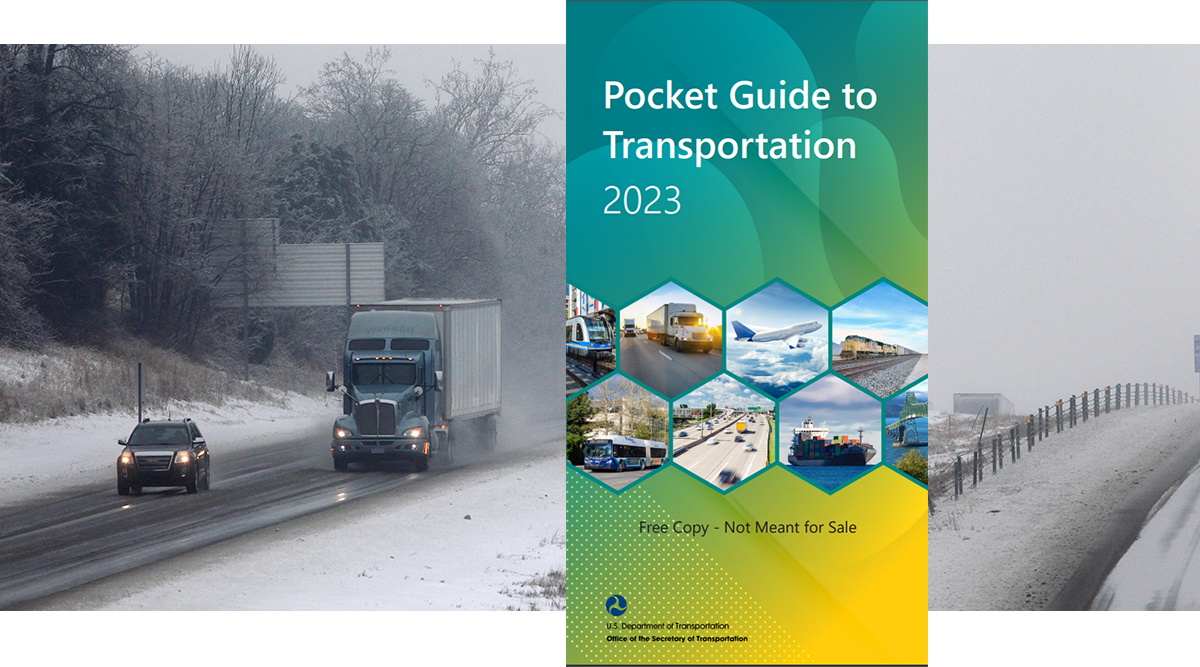
A 72-page “Pocket Guide to Transportation 2023” from the federal government is available online and in print with key statistical data and highlights of major national transportation data trends.
The reference guide, published recently at the direction of the Department of Transportation’s Office of Transportation Analysis, consists of information from the Bureau of Transportation Statistics, the departments of Commerce, Energy and Labor, the Environmental Protection Agency and other sources.
Information is arranged by these categories:
- Infrastructure
- Moving people
- Moving goods
- Safety
- Performance
- Economy
- Environment
The guide also provides comparative statistics, primarily measuring 2020 against 2010.
Since 2010, for instance, the U.S. transportation network through 2020 had seen a 25.2% increase in the number of trucks on highways, from 10,770,054 to 13,479,382.
In that span the network also added 13,963 highway bridges (totaling 618,456) and more than 140,000 miles to the nation’s 4.17 million miles of public highways.
Waterway additions over the same period numbered 14 to reach 192 ports handling over 250,000 short tons, and 8,334 docks handling cargo (an increase of 274).
Drops were noted in Class I for both freight locomotives (1.46% to 23,544) and freight cars (36.5% to 252,400).
While the condition of pavement in the national highway system ranking “good” improved by 3% to 63%, the International Roughness Index rate for “poor” rose to 10% from 7%.
Drastic spikes were seen in sales of green vehicles in 2021 compared with past years.
- 799,000 hybrid-electric vehicles (up 191% compared with 2010)
- 459,400 battery-only EVs sold in 2021 against only a blip shown as sold for the first time in 2011.
The pocket guide is available online via the DOT at https://www.bts.gov/pocketguide. A printed copy can be ordered by calling (800) 853-1351 or ordering online at https://www.bts.gov/order-form-printed-bts-publications.


