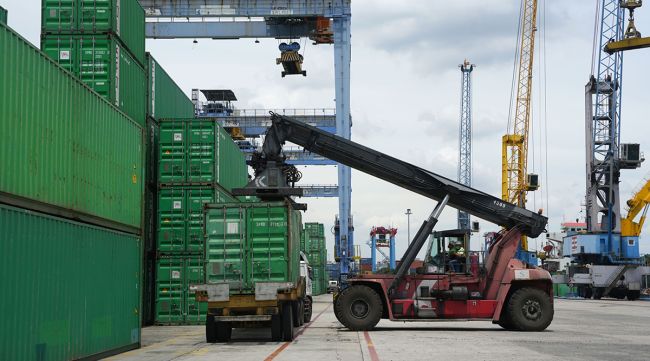
A reach stacker moves a shipping container in the IPC Container Terminal at Tanjung Priok Port in Jakarta, Indonesia. (Dimas Ardian/Bloomberg News)
The global trading system is undergoing tectonic shifts that will reorient international supply chains for decades to come.
Blame two main forces. Companies spooked by pandemic shortages, price spikes and shipping disruptions are reducing reliances on a single factory or country. Meanwhile, governments — especially those in the U.S. and Europe — want to ensure access to key materials like semiconductors and rare-earth minerals in case the world trade splinters into geopolitical blocs.
The transformation that some are calling “reglobalization” will take years, and trade data is only beginning to offer clues about the scope of the changes, and who’s winning and losing.
Here are eight indicators to watch to help understand the implications of this new era of geostrategic economics.
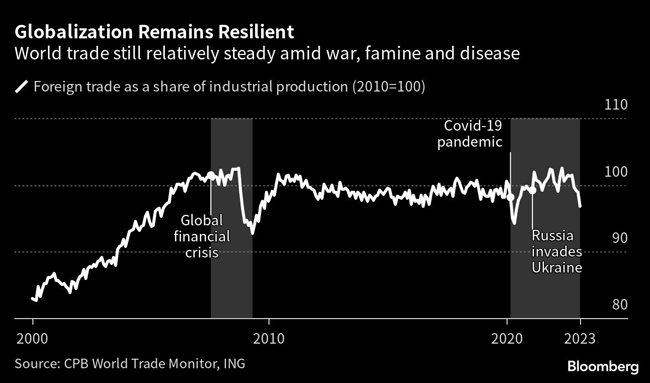
Despite talk of globalization’s demise, economic integration via cross-border commerce has shown remarkable resilience through war, famine and a pandemic. Over the past three years, world trade as a share of global production has softened a bit but remains largely in line with historical trends. In fact, there has been no meaningful shift in the trajectory toward greater trade openness since at least 2006, according to a recent ING Groep NV analysis.
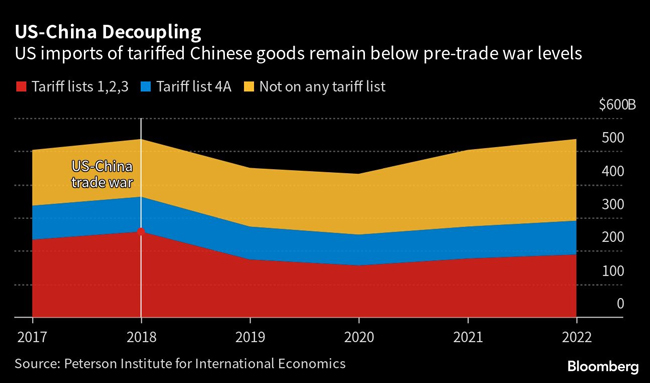
The increase of geopolitical tensions between Washington and Beijing spurred speculation about a sectoral decoupling between the world’s largest economies. While the value of U.S. imports of Chinese goods and services reached the highest on record in 2022, there are signs that U.S. tariffs are shifting bilateral trade flows. Last year, U.S. goods imports from China that are subject to tariffs fell by about 14% versus 2017 pre-trade war levels, according to analysis from Chad Bown, a senior fellow at the Peterson Institute for International Economics.
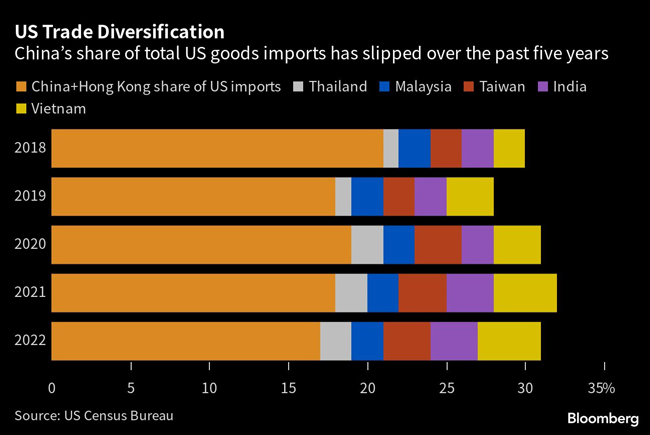
Over the past five years, U.S. tariffs, export restrictions and subsidies have persuaded American companies to diversify their imports away from China. The total share of Chinese imports to the U.S. has slipped about 3 percentage points since 2018, when former President Donald Trump imposed tariffs on thousands of Chinese goods. During this time, China ceded a portion of its share of total U.S. imports to other Asian export nations like Vietnam, India, Taiwan, Malaysia and Thailand.
That said, Chinese manufacturers looking to sidestep U.S. tariffs and shorten supply chains are opening operations in nations such as Vietnam, Thailand and Mexico.
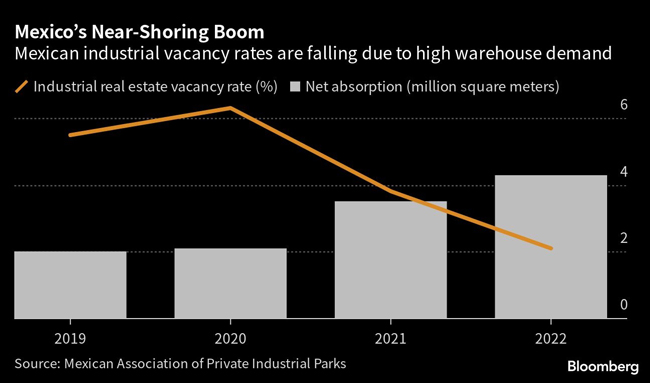
Mexico is becoming a key U.S. sourcing alternative to China. Highly integrated U.S.-Mexico supply lines and preferential trade treatment under the USMCA are helping to create investment opportunities across the border. Importers — and even some Chinese exporters — looking to diversify their supply chains are racing to snap up Mexican industrial space, which reached a 97.5% occupancy rate in 2022. Demand for warehouses and other industrial properties is particularly high along the U.S. border near Tijuana where industrial vacancy rates are near zero. Some 47 new industrial parks are either planned or under construction, according to the Mexican Association of Private Industrial Parks.
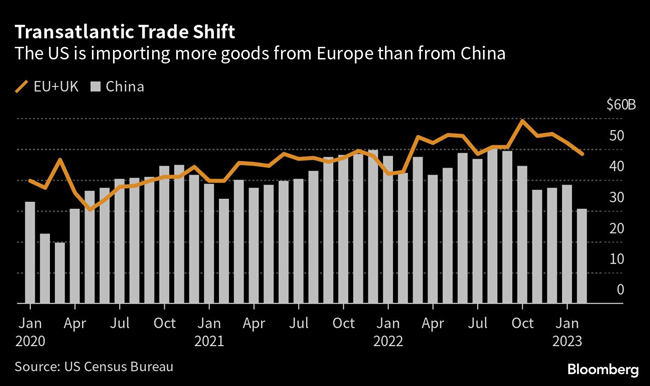
President Joe Biden’s efforts to improve trade relations with Europe have resulted in a shift toward greater U.S. reliance on imports from Europe than from China. The pivot came after the U.S. and Europe shelved duties on bilateral trade worth $21.5 billion in 2021, paused an aircraft-manufacturing dispute dating to 2004, and launched talks to reduce overproduction of steel and aluminum. Over the past year, the value of U.S. imports from Europe has increased by almost 13%, whereas U.S. imports from China only grew by 6%.
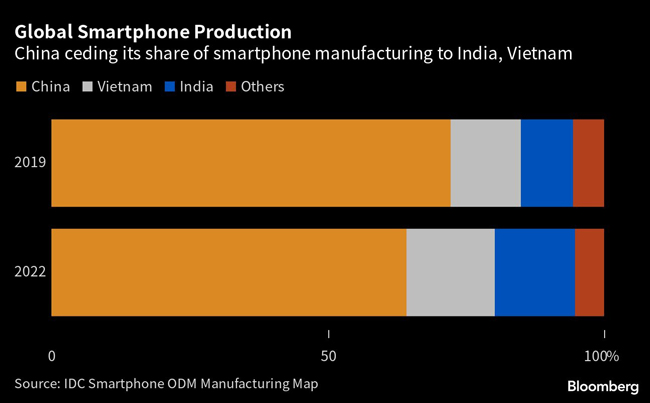
Smartphone manufacturers like Apple Inc. are working to reduce their dependence on China as a trade war between Washington and Beijing intensifies. In the year through March, Apple tripled its Indian production footprint to manufacture more than $7 billion of iPhones. India now accounts for some 7% of Apple’s global iPhone output, and annual sales in the country have surged to $6 billion.
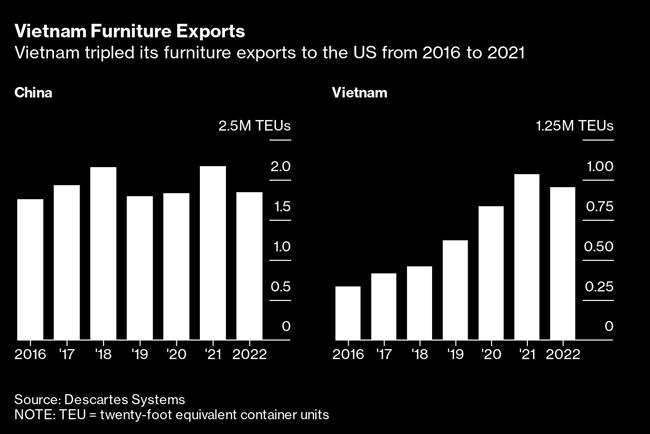
Vietnam is another hub for companies looking to diversify away from China. Over the past seven years, U.S. container imports of Vietnamese furniture grew 186% versus only 5% growth in such imports from China. Vietnam now accounts for half of China’s total export volume for U.S.-bound furniture products, according to Descartes Systems Group Inc. Recently, orders for Vietnamese furniture are beginning to decline due to falling global demand for consumer goods.
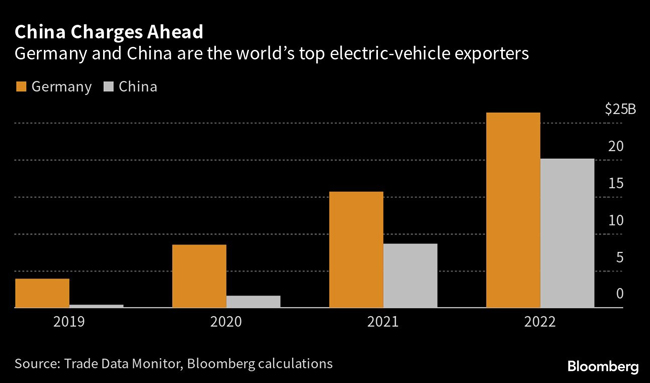
Beijing’s industrial policies have catapulted China to become the largest exporter of electric vehicles after Germany. This year, electric vehicles and plug-in hybrids are on track to reach about 40% of China’s total vehicle deliveries. Meanwhile, Europe’s share of global electric vehicle sales are “likely to grow this year as more models become available and supply chain issues ease,” according to Bloomberg Intelligence.

